

Expected Points - A Sports Data Breakdown
Expected Points - A Sports Data Breakdown
The latest sports data/analytics piece for KCSN from contributor, Joseph Hefner

If you’ve seen much work from analysts, you’ve probably run into Expected Points (EP) and its friend, Expected Points Added (EPA). But what exactly are they, and why do we care. Let’s talk about it.
The idea of Expected Points was actually first introduced in 1970 by Vincent Carter, the Bengals starting QB, and Robert Machol, a professor from Northwestern University.
That’s right, this metric was created by an actual football player. It took a simple concept, that teams are more likely to score points the closer they are to their opponents end zone, and assigned numbers to that likelihood based on historical outcomes of actual teams when they were in that position.

This idea has been refined and updated over time, but the core idea remains. In current public NFL analyses, Expected Points is calculated using historical NFL data from 1999-current. It is based on a number of factors, including yard line, time remaining in half, down, yards to go, timeouts remaining, indoor/outdoor stadium, and whether the offense is at home. Expected Points are also era adjusted, so it accounts for rule changes that make scoring more likely in 2020 than it was in 2000.
Expected Points Added (EPA) takes the Expected Points from before a play, and subtracts it from the Expected Points after it sees the outcome of that play. If the EPA is positive, then you are estimated to be MORE likely to score after the play than you were before the play. If it is negative, then you are LESS likely to score after the play.
As an example, the Chiefs received the ball first versus the Titans. Their offense took the field at the 26 yard line. In the hundreds or thousands of other times where a team has started their drive from around the 26 yard line, the average outcome of that drive was 1.51 points. So, this drive has an EP of 1.51.
After the pass to Kadarius Toney for 2 yards, the Chiefs had a 2nd and 8 at the 28 yard line. The average outcome of that situation was 1.03 points. That means the average offense was LESS likely to score points after that screen pass than they were before it. The EPA for that play to Toney was 1.03 – 1.51 = -0.48. That’s not good! Of course, the Chiefs are anything average, so we ended up with a field goal anyway.
EPA is probably my favorite metric, and is certainly the one I use most often. It is a fantastic measure for evaluating an offense or defense. It works pretty well for evaluating QB’s, as they have such an outsized role in an offense’s efficiency, but isn’t very useful when applied to other positions. WR’s are dependent on a QB throwing them the ball. RB’s are dependent on an offensive line opening up holes for them.
We can use EPA/play to evaluate how effective different play types are for a team, or the NFL. For example, take a look at this graphic.
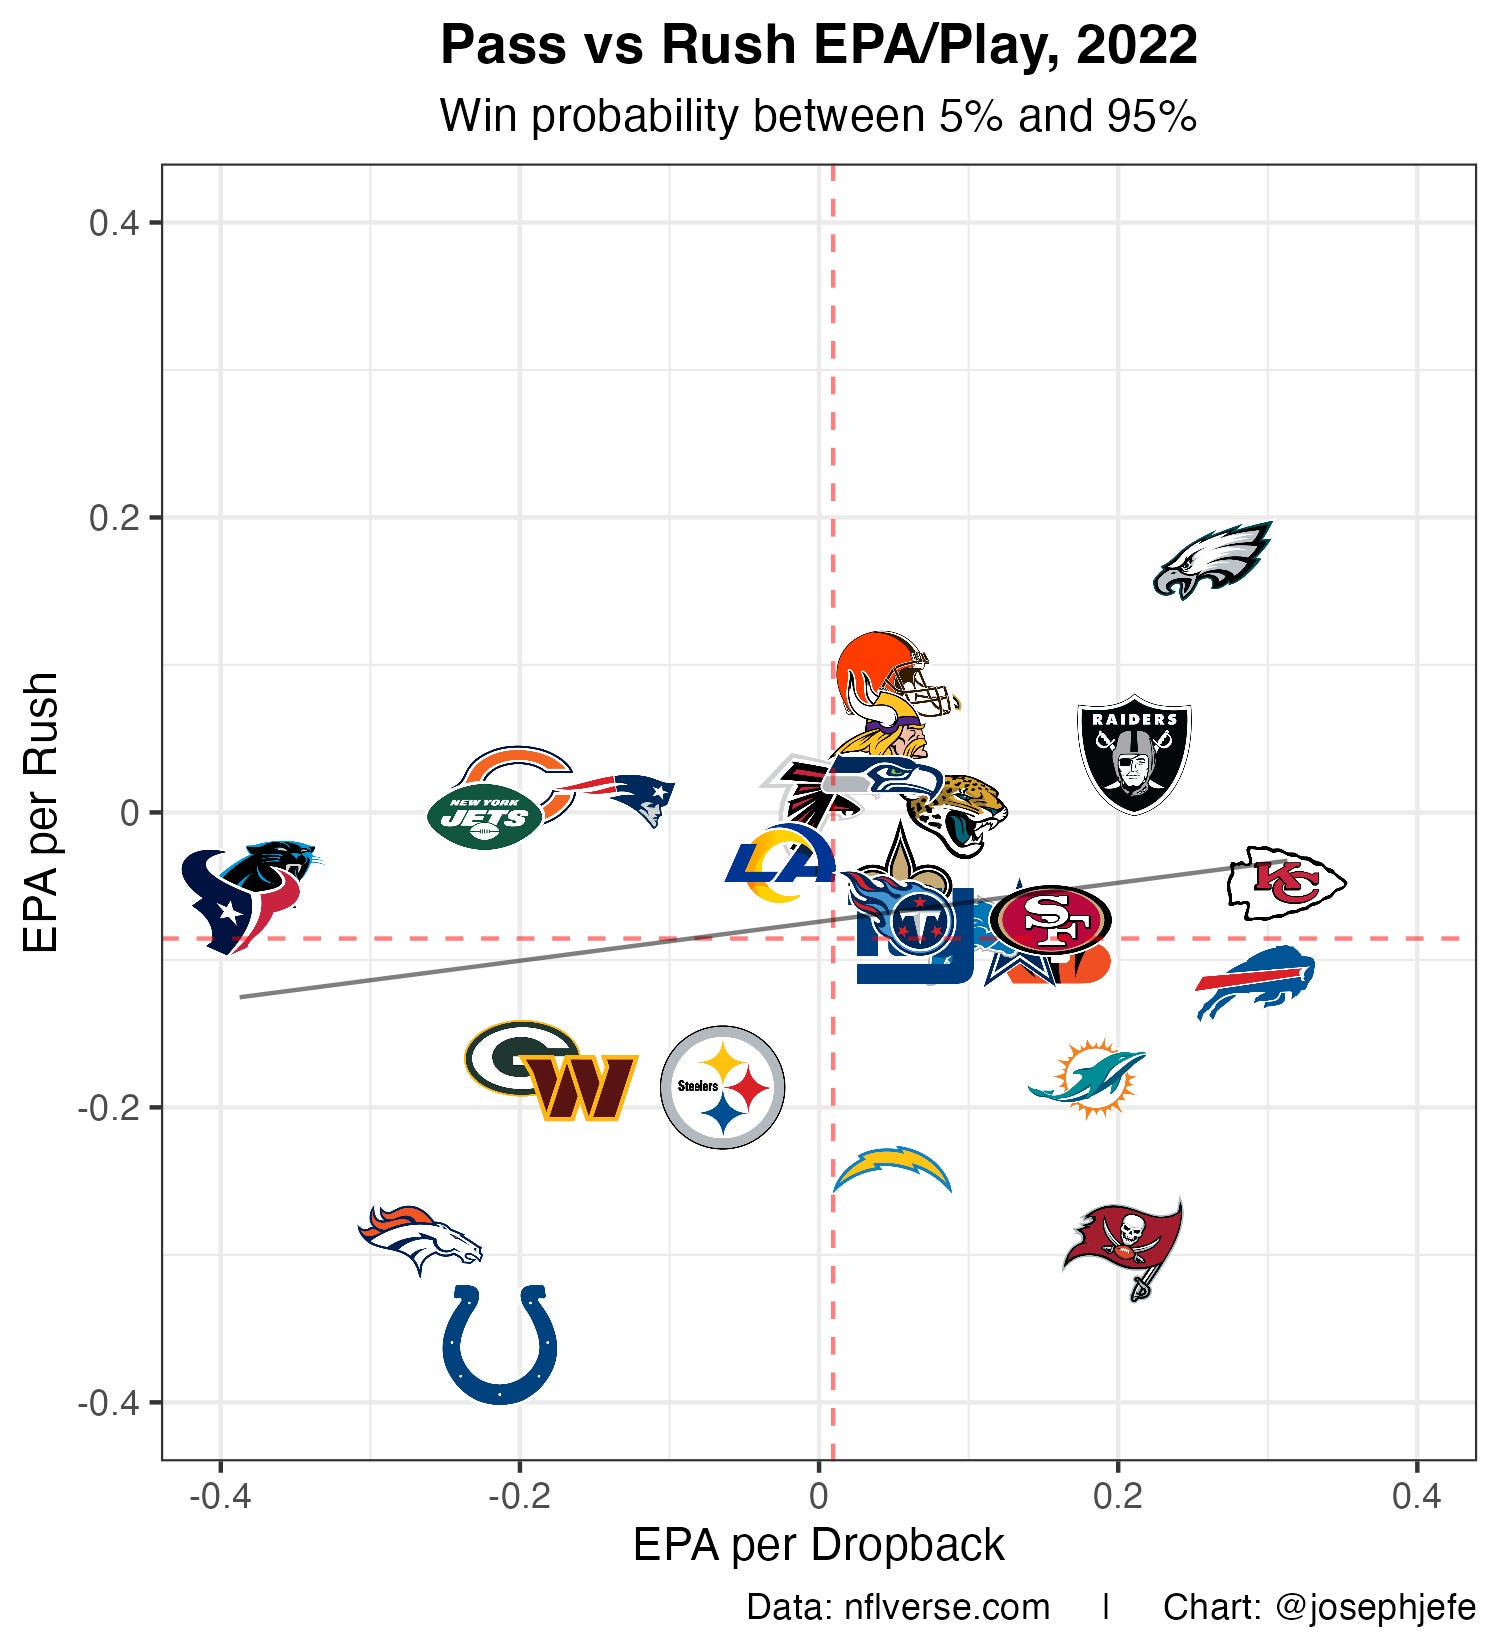
The X axis shows the EPA per drop back (dropbacks include scrambles, but not designed QB runs) for each team, and the Y axis shows the EPA per rush. Up and to the right is where you want your team to be. The dotted lines are the NFL averages. Notice how much extra white space there is at the top of the Y axis. Only the Eagles have an EPA/rush of higher than 0.1. Only 9 total teams have a higher than 0 EPA/rush. The NFL average is -0.08.
For the Chiefs specifically, the average EPA/rush is -0.05, while the average EPA/drop back is an NFL leading 0.31. That very much meets the eye test, doesn’t it? Our running game has not been good for much of this season. And yet, there are 17 NFL teams who are WORSE than we are at running the ball. We are somehow an above average running team. That does not say good things about the state of rushing in the NFL.

This analysis, and many others like it using other efficiency stats, pretty clearly shows that passing is more effective than rushing in today’s NFL. {sees pitchforks incoming} HOWEVER!! Run plays have uses!! They are actually more efficient than passes in short yardage and goal line situations. They give your QB a break so he doesn’t have to pass 68 times a game. They burn more clock in late game situations.
Analysts DO NOT WANT the run play to go away! I promise! We are just advocating for a more efficient run/pass ratio that maximizes our chances to win. Chiefs actually do very good job of this. We drop back to pass 71% of the time. But we’ve all been frustrated by that delightful 2nd and 10 (or more) run play that Reid loves so much. Those are the sort of runs that we are advocating against. Run in advantageous situations, like goal line, short yardage, light boxes, etc.
Of course, no model is perfect, or can by itself tell you the outcome of the game. For example (trigger warning!!), here’s the EPA/play for Chiefs vs Colts (via rbdsm).

Green is good. Purple is bad.
Look at all the purple for the Colts!! And yet, they won the game. Models predict likely outcomes. Sometimes the unlikely outcome happens instead. That doesn’t make the model useless. It just means it’s not infallible.
That’s why they play the games.

You make a lifetime of difference for a child or teen.
Boys & Girls Clubs is looking for dedicated men and women to invest in the lives of youth through coaching. Did you know by participating in sports, children learn the value of teamwork, responsibility, good sportsmanship, and self-esteem? By becoming a volunteer coach, you are helping to power the dreams—and successful futures—of Kansas City’s kids! The Clubs are currently seeking baseball coaches. Click here to sign up today! All equipment will be provided. No prior coaching experience is needed.
 | A guest post by
|