NFL Trade Charts and Future Discounts
The latest newsletter from KCSN Sports Data Scientist, Joseph Hefner.
The Kansas City Chiefs traded L’Jarius Sneed last week for a future 3rd round pick from the Tennessee Titans. This sparked a great deal of discussion amongst Chiefs fans about NFL compensatory picks, salary cap spending vs cash spending, the value of a single year of a great player vs a mid-round future asset, and more.
All of those discussions are valid and interesting, but the one that specifically caught my interest was the discussion about how the NFL views future draft capital. There is a long-standing tradition of fans and media declaring a full round discount as the standard. Others, especially analysts, argue that the discount should be much smaller.
Last year, I made a Trade Calculator App, which calculates the value of the picks in any trade and shows which side of the trade received more value, based on several trading charts. I set that app up with a default 10% discount on any future picks, and a slider that allows the user to manually adjust that per their own preference to any value between 0% and 50%.
The Sneed trade convinced me to actually research this topic and see if I can provide any hard numbers based on real NFL trades. If you are interested, you can find the code I used for this analysis on my GitHub here.
Before we can analyze what kind of a discount teams give to future picks, we need to establish what chart the NFL as a whole uses as their baseline. Many teams have an in-house chart that they use. I doubt any team simply uses one of the standard charts as their only chart. Each team might value picks differently. However, given a large enough sample size, we can see which chart ends up the closest to what actually happens in the NFL.
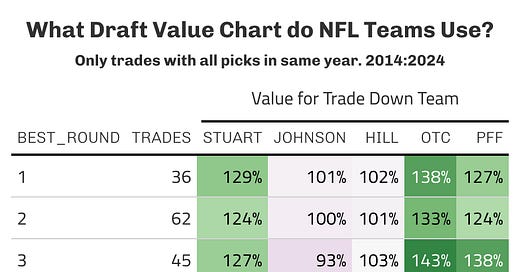
In this table, I have filtered for only trades that involved draft picks from the same draft year. No trades involving players, and no trades involving future picks. I calculated the value of the picks the trade up team received, and the value of the picks the trade down team received. This table shows the percentage of value the trade down team received. A value of 100% means the trade is exactly even. Anything above 100% means the trade down team received extra value. Anything below 100% means the trade down team lost value.
I split this table by the round of the best pick that the trade up team received. Looking at round 1, the trade down team received 129% of value, or +29% value, per the Stuart chart. The classic Jimmy Johnson trade chart shows a value of 101%, which is the closest to perfectly even (100%) for this round. The Johnson chart is exactly 100%, perfectly even, for picks that had a round 2 pick as the best pick.
In the third round, the Rich Hill chart is the closest to even, with the trade down team receiving 103% value. The Johnson chart is second, at 93%. The Hill chart is the closest to even for all the rest of the rounds (rounds 3-7). However, given the significantly more overall value of first and second round picks, the Jimmy Johnson chart ends up the closest overall to dead even, at 99%, compared to 102% by the Rich Hill chart.
Both of these charts are very close in value to what we actually see represented in real NFL trades. For the remainder of this analysis, I will be using the Jimmy Johnson trade chart, but if you prefer the Rich Hill chart, it is almost identical in accuracy to the Johnson chart, and is a perfectly reasonable preference.
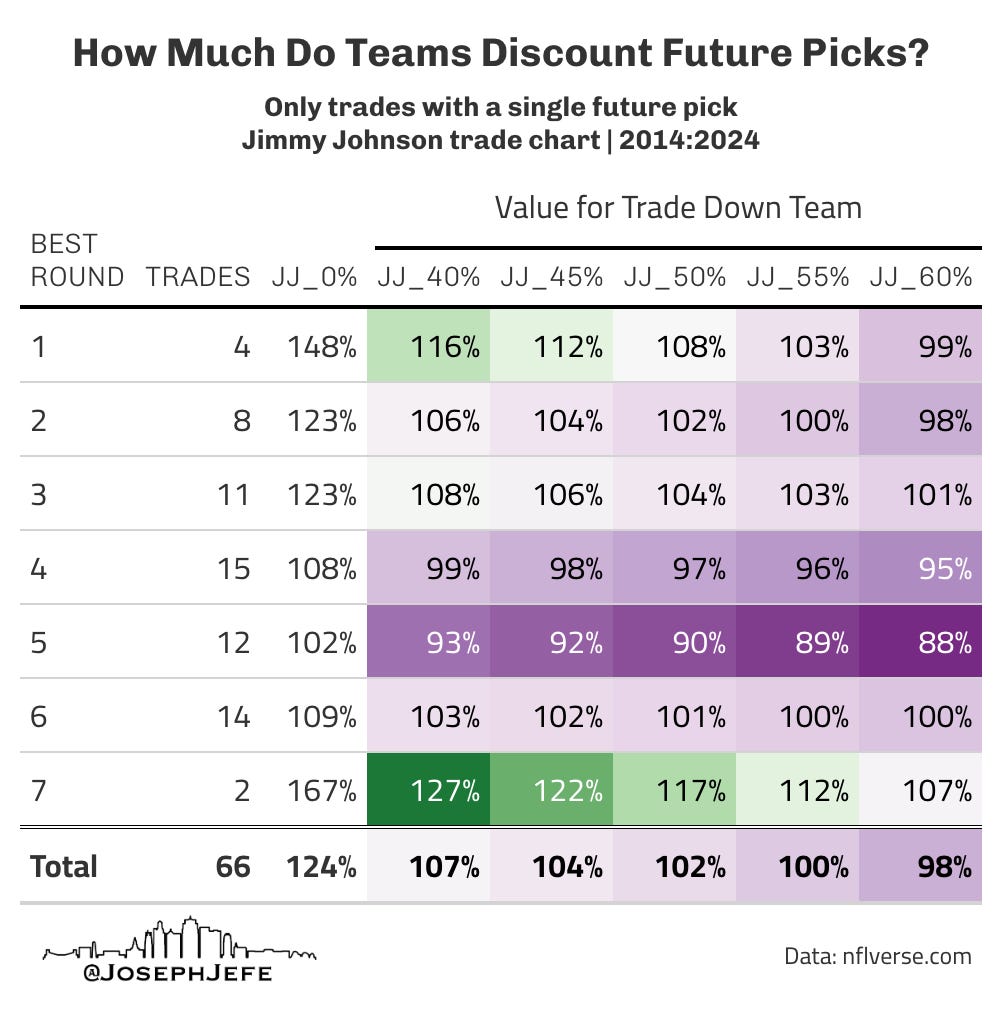
Now that I know which chart the NFL uses as its baseline, I can start calculating what percentage of a discount teams give to future picks. In this next table, I’ve filtered to only trades where the trade down team has received a single future pick. They can have received multiple picks in the same year, but to keep the calculations as clean as possible, I want only a single future pick involved.
This next part is easier with an example. In 2023, the Vikings traded up with the Chiefs for the 119th pick. Vikings received: 119. Chiefs received 134 + a future 5th, which ended up being pick 167 in 2024.
Vikings: 119 (56 points on Jimmy Johnson chart)
Chiefs: 134 (39 points) + 167 (25 points with 20% discount [25 * 0.8] = 20 points)
I’ve used a 20% discount in the above example, but I played with a ton of discounts to find out what actually matched what the NFL uses. In this next table, you can see the percentage values for all trades by the round of the best pick the trade up team traded for. Each “JJ” column is the Jimmy Johnson (JJ) chart, followed by the percentage discount given to future picks. It starts with “JJ_0%” so you can see the values without any discount whatsoever.
In this table, we are once again looking for the values closest to 100% (equal value). I have calculated percentage discounts from 40% to 60% in 5% increments. At the bottom, you can see the overall percentages.
Here are the closest results:
First Round: 60% discount
Second: 55%
Third: 60%
Fourth: 40%
Fifth: 10% (not shown)
Sixth: 60%
Seventh: Only 2 trades. Not a large enough sample size.
Overall: 55% discount on future picks.
We can see that the values differ by round of the best pick. Outside of the 5th and 7th rounds, it’s between 40% and 60%. This is likely noise. A larger sample size would probably even out the discounts, though trades involving first rounds might maintain an extra “tax”. The overall total shows that the 55% discount gives a perfect 100% value.
Now that we know what the standard discount should be, we can calculate the value of the L’Jarius Sneed trade. Assuming the Titans end up with a mid-round pick, their third round pick should be somewhere around pick 80. Pick 80 is valued at 190 points. With a 55% discount, that equals [190 * 0.45] 85.5 points. That values the pick as the 105th pick in the NFL draft. Basically the top of the fourth round.
Had we simply rescinded the tag, allowing him to reach free agency, and received a 3rd round compensatory pick (far from guaranteed), it would have been around pick 100. With a 55% discount, that would end up valued as pick 127. That’s a 22 pick jump up by trading him rather than cutting him, assuming best case scenario of a 3rd round comp pick. The Jimmy Johnson trade value chart drops precipitously in the fourth round. Pick 105 is worth 85 points. Pick 127 is worth 45, almost half the value.
Brett Veach nearly doubled the value of a compensatory pick with this trade, and is not constrained from adding free agents by trying to maintain that compensatory pick. Perhaps another year of Sneed on the tag was worth more than a future 3rd , plus the $19.8m in cap space. I will not argue with you. However, the trade with the Titans was certainly worth more than simply cutting him and possibly reaping a 3rd round compensatory pick.


Another interesting thought exercise. Thank you for doing all the legwork on this.
One quibble - towards the end, you mention cutting Sneed and getting the compensatory pick, but comp picks are not for players who are cut. The hypothetical is if the Chiefs had not placed the franchise tag on Sneed and he signed as a free agent since his contract had expired.
Reasonable people can disagree whether the compensation was worth losing the player. Sneed has been awesome for us and on a positive trajectory throughout his time with the team. But that also means his value was probably at its peak. There is depth in the defensive backfield. I don't expect Williams and Watson to be as good as Sneed, but I think they are capable players ready for a larger role. If there is one spot where players consistently overperform their draft status for KC, it is in the defensive backfield. The front office and coaching staff have earned our trust, especially back there.
Kudos Joseph!
So we should be using the JJ chart for rounds 1-2 and the Hill chart for 3-7?
I'm surprised the JJ chart came out on top as the Hill chart was specifically formulated based on actual NFL trades post CBA that only involved draft picks. I feel like I have read comments form former NFL executives that said the JJ chart was pretty accurate except for the 1st round overvaluations.